
Debugging a memory leak in elixir
Few days back, one of the operators running rudder reported that the memory overflowed after every few days.
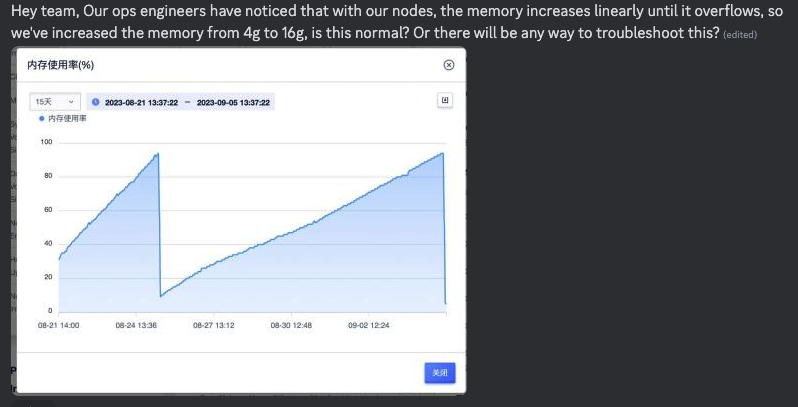
overflow
Rudder is written in Elixir as it was an excellent language for
building fault-tolerant systems. It has a great concurrency model
(lightweight processes), has hot code upgrades, and is in general great
for writing softwares which need to run for a long time.
This looked like a memory leak, and the next step to do was figure out
where it was happening.
I used the observer graphical tool. It provides features
for monitoring and inspecting a runtime system – allowing you to trace
method calls, check ports and devices, and see detailed breakdown of
memory usage.
>> rudder
-> iex -S mix

Interactive Elixir (1.15.4) - press Ctrl+C to exit (type h() ENTER for help)
iex(1)> Mix.ensure_application!(:wx)
:ok
iex(2)> Mix.ensure_application!(:runtime_tools)
:ok
iex(3)> Mix.ensure_application!(:observer)
:ok
iex(4)> :observer.start()
:ok
iex(5)>
This launches the observer UI:
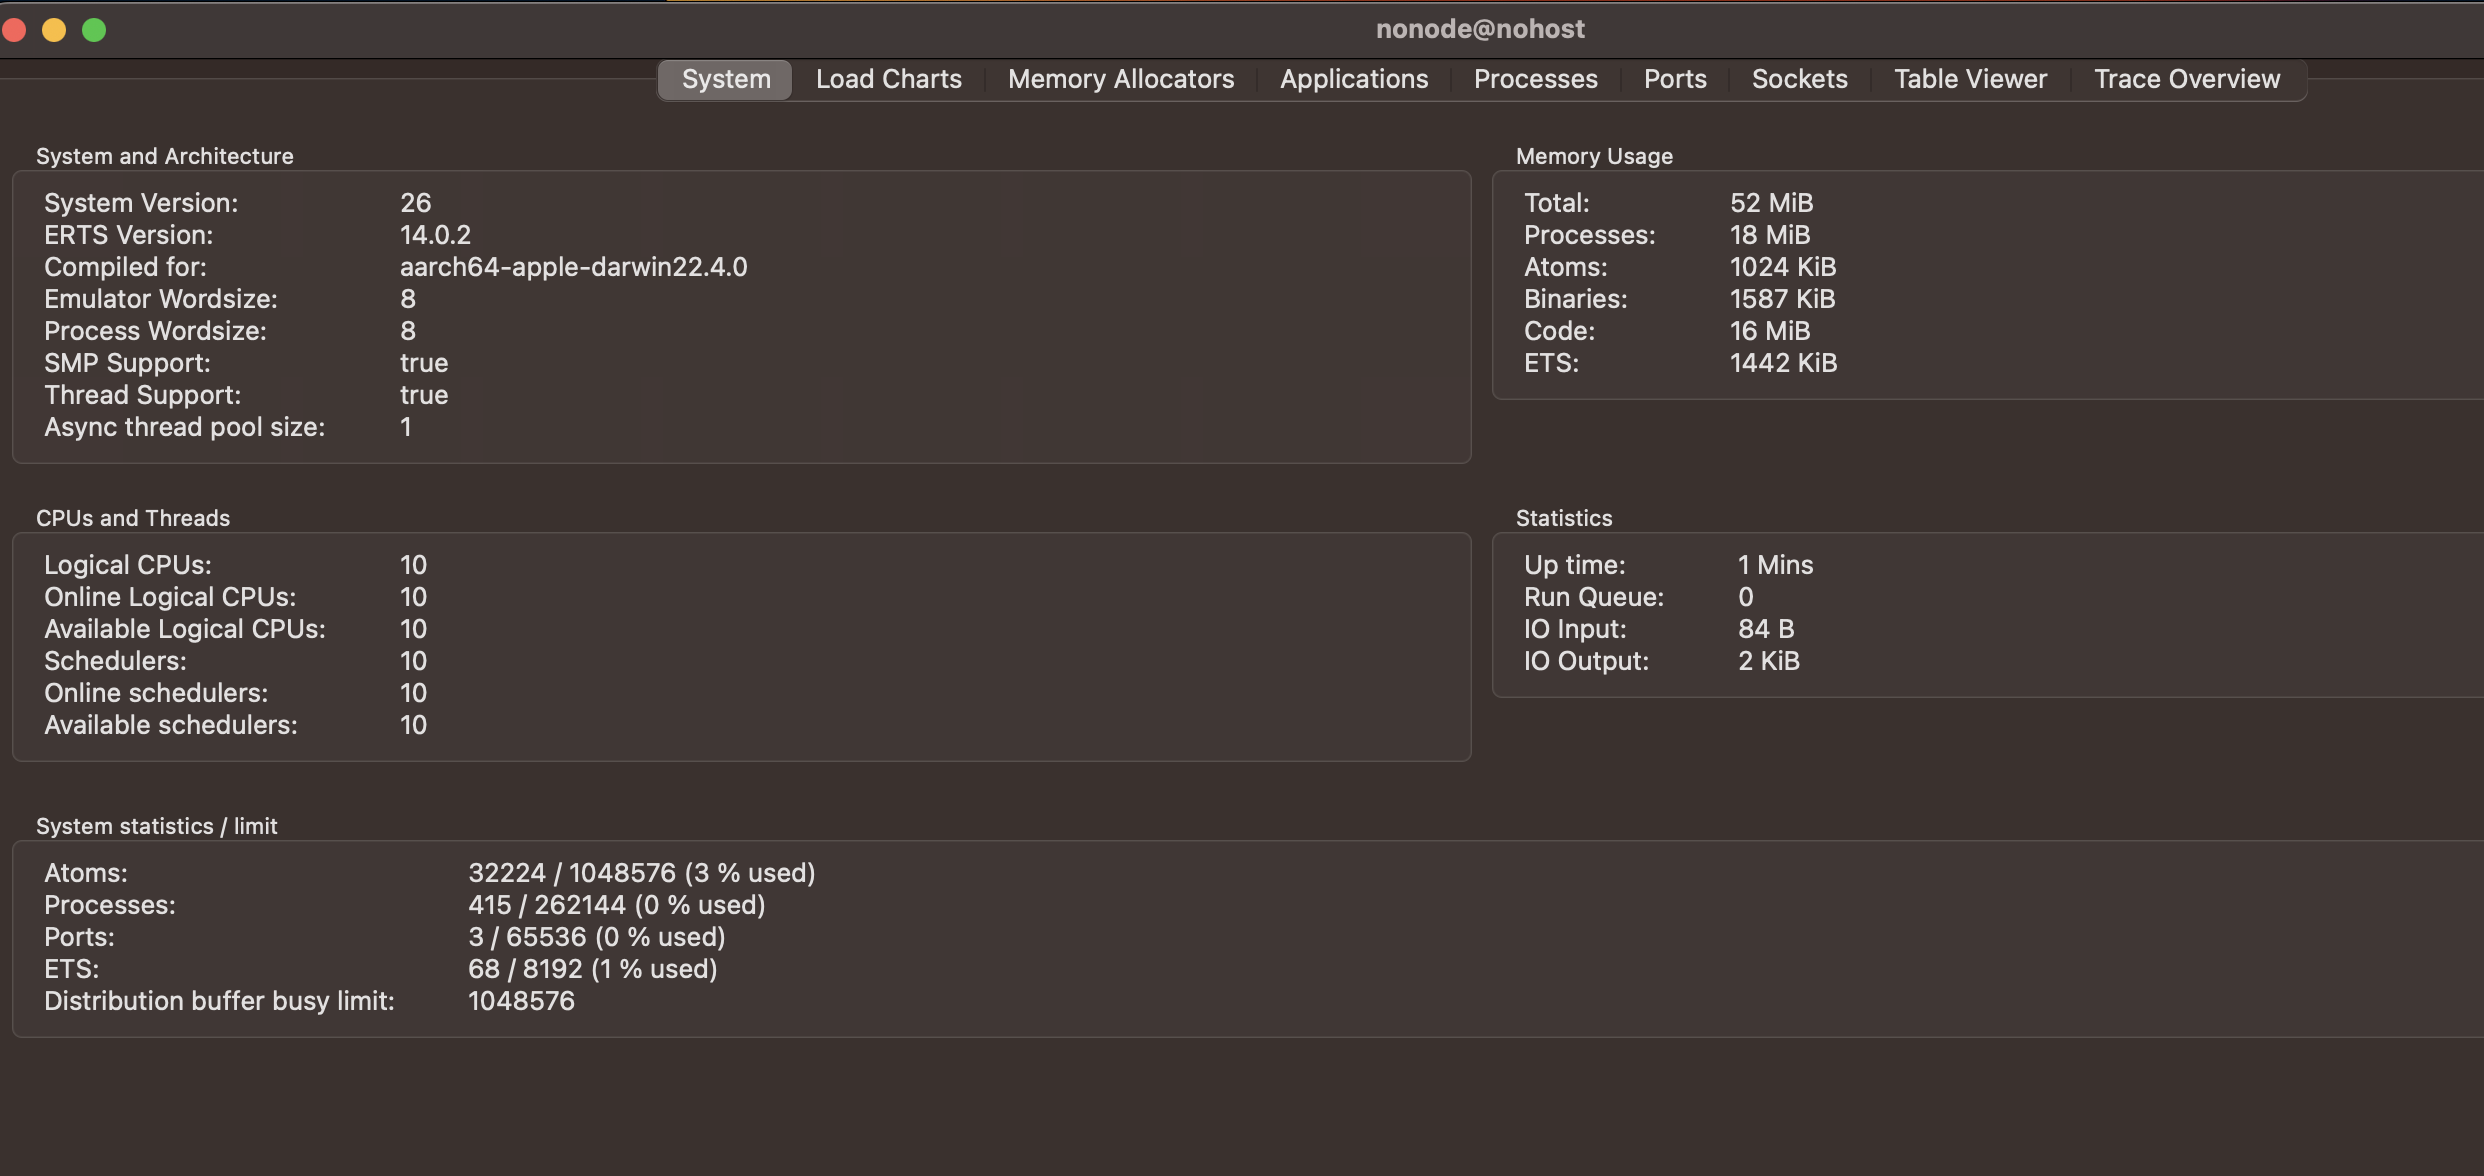
observer starting UI
I then start the rudder listener, which is the long running process:
iex(5)> Rudder.ProofChain.BlockSpecimenEventListener.start()
[info] starting event listener
[info] retrying older uprocessed bsps (if any) before starting to listen
[info] getting ids with status=discover
......
With the rudder running, I went to the Memory Allocators
tab on the observer, and noticed steady rise in total memory usage (and
eheap_alloc) when left running for few minutes.
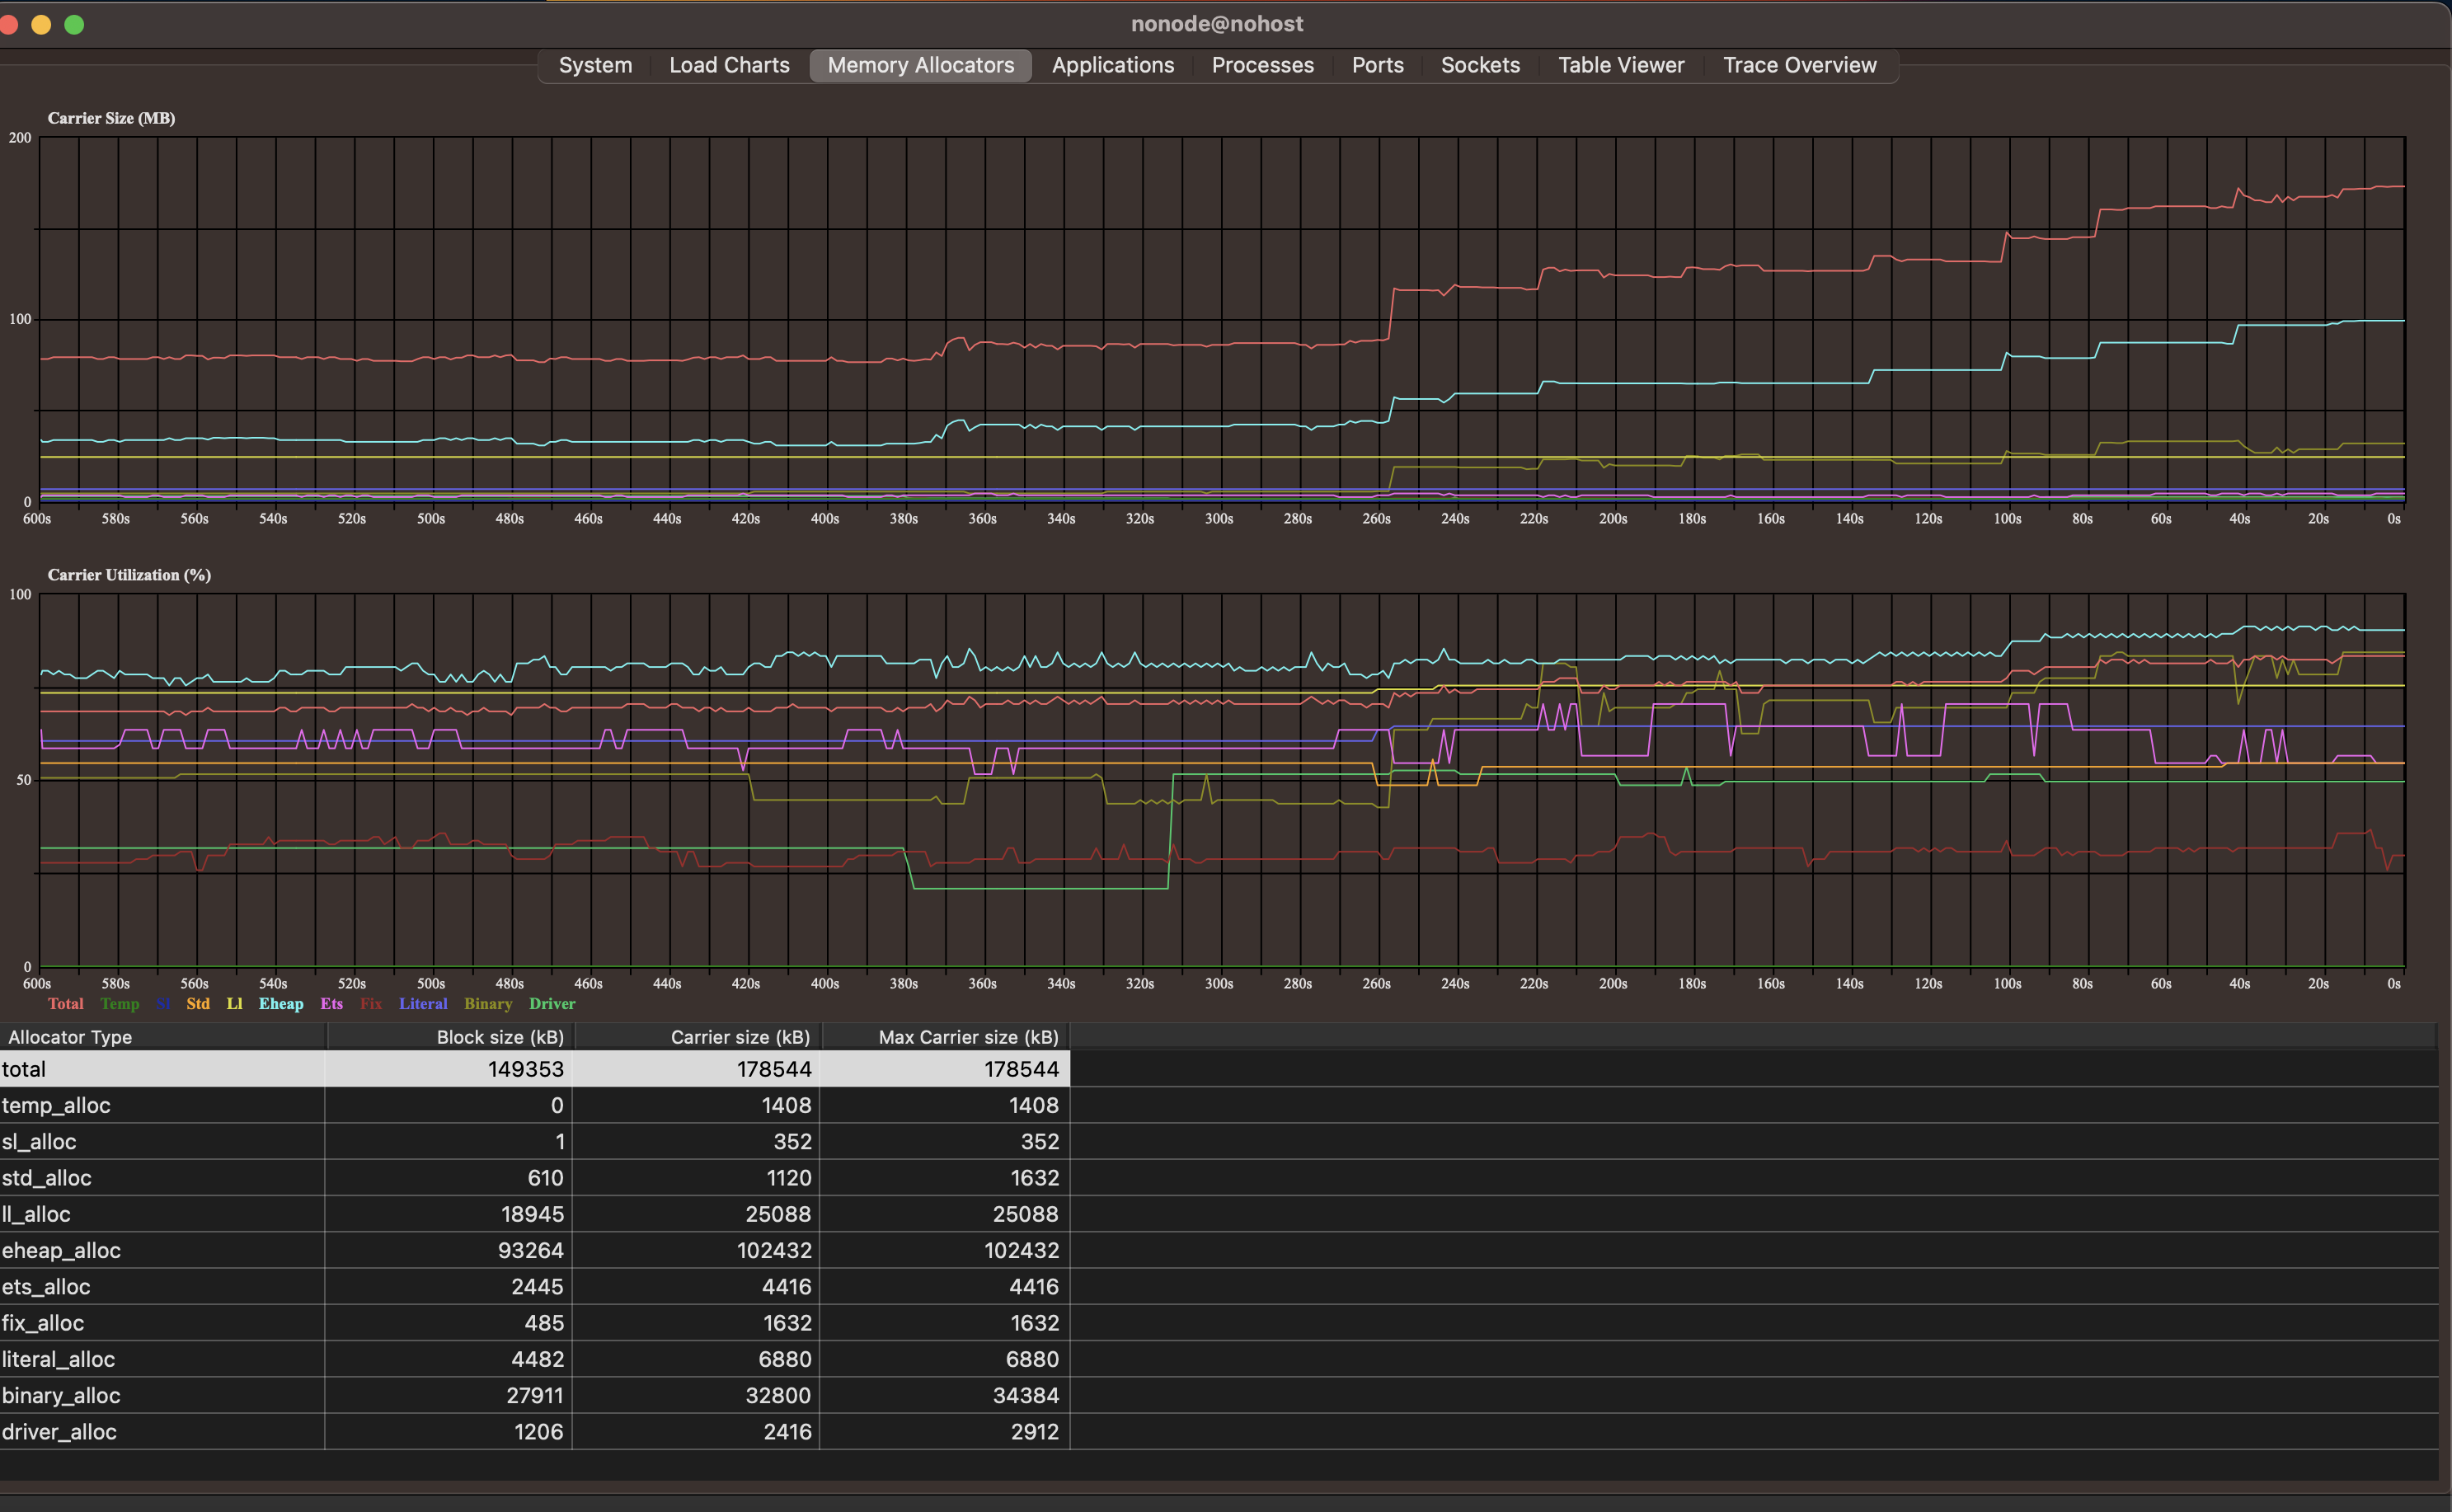
Rising Tide
So there was some kind of resource leak happening in rudder. But what
was it? The above graph showed that it was happening, and that it was
happening in the heap, but I needed to nail the issue down further.
After a bit of playing around and understanding the UI (chatGPT was
great at this btw), I went to the Processes tab and sorted
the entries by Memory
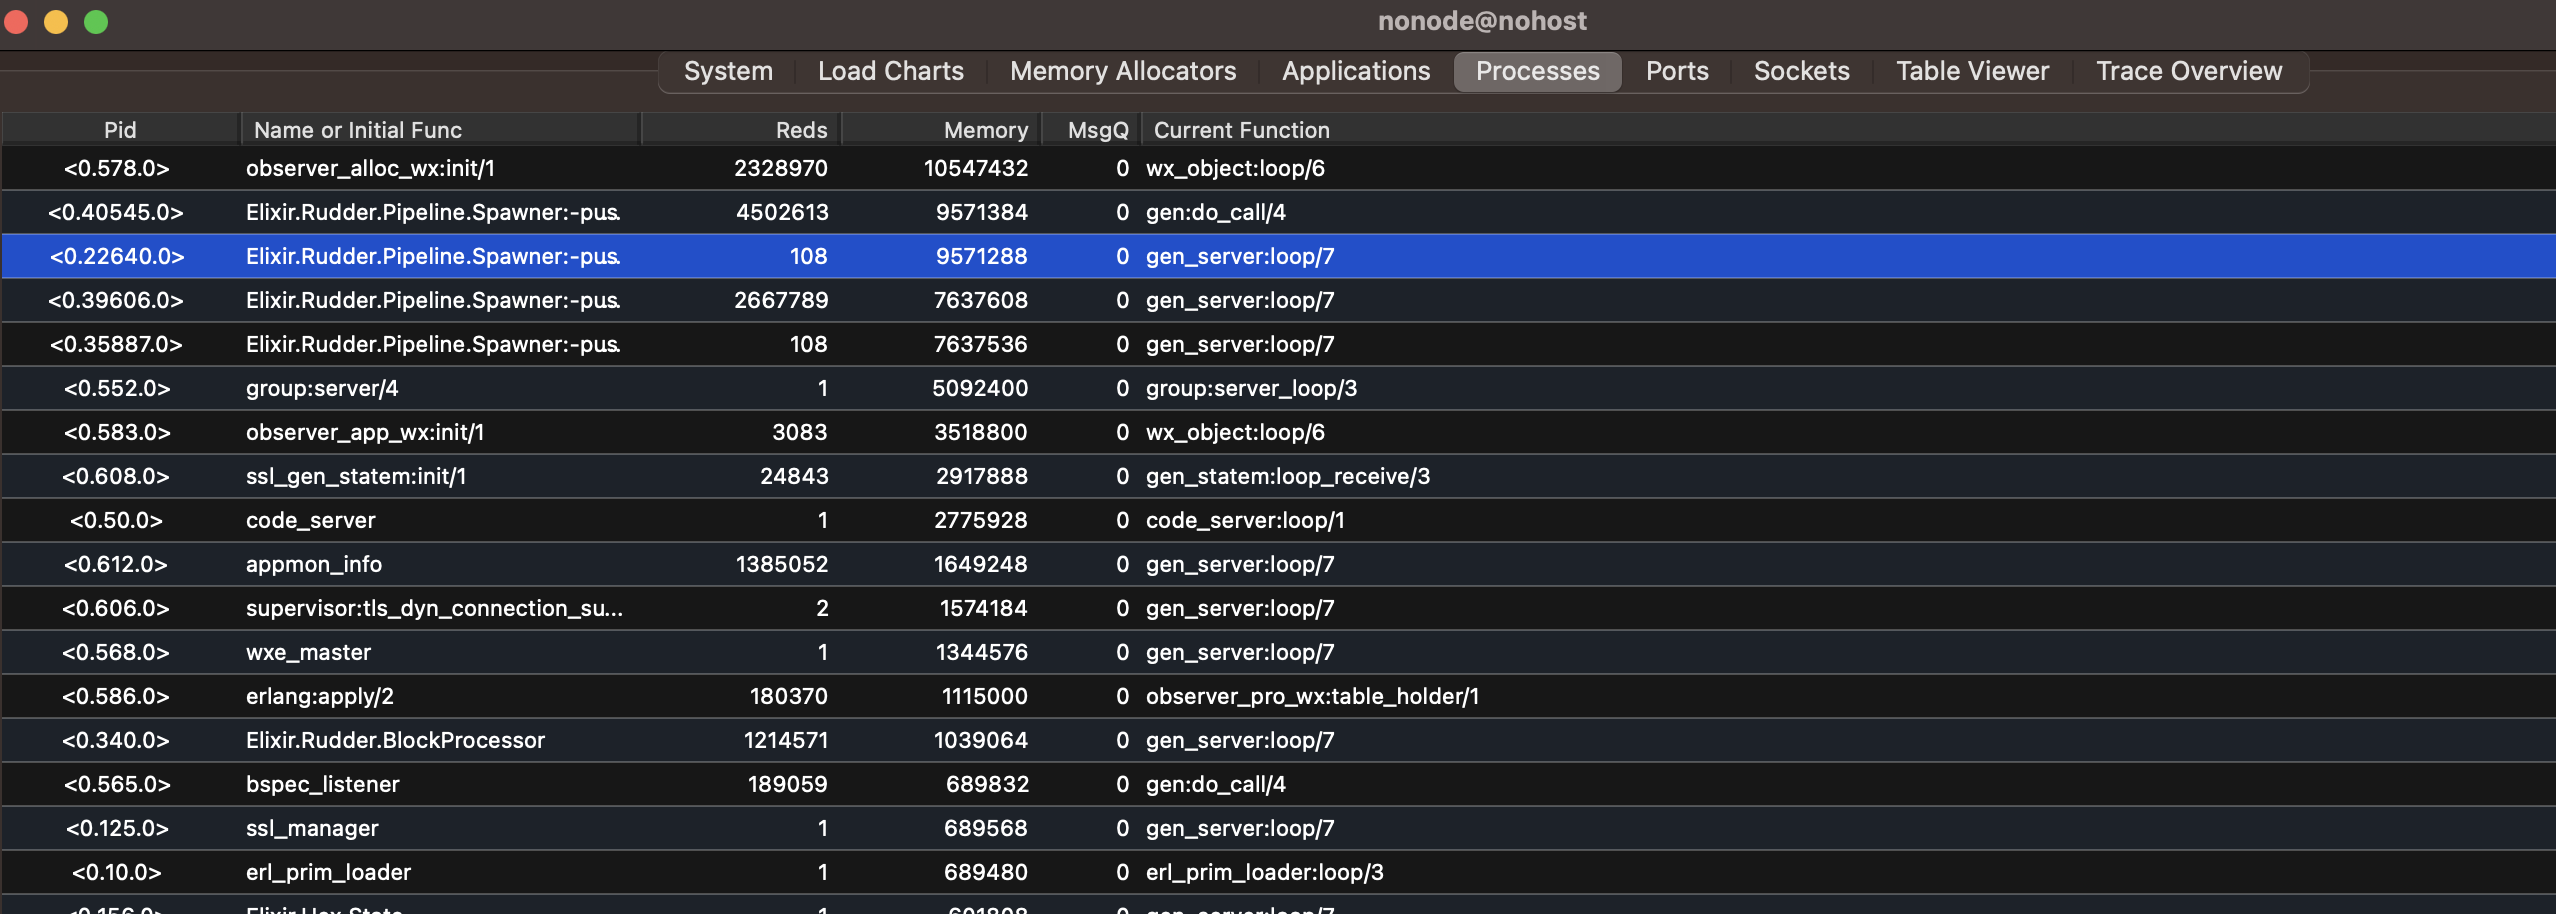
Leaking processes
It was apparent that the number of
Elixir.Rudder.Pipeline.Spawner.push_hash tasks were
growing, each of total size of around 7MBs, and never terminating. The
accumulation of such non-terminating tasks might be causing the leak.
This was also verified from the Applications tab, where the
Elixir.Rudder.Pipeline.Spawner was having more and more
childrens, while it was expected that the spawned tasks would end
(erased/GC'd) once the task was executed.
The push_hash function was this:
    def push_hash(bsp_key, urls) do
      DynamicSupervisor.start_child(
        __MODULE__,
        {Agent,
         fn ->
           Rudder.Pipeline.process_specimen(bsp_key, urls)
         end}
      )
    end
  end
The child process started is an Elixir Agent, which is actually an event-loop employing long-running process. That's not what we need! What we need is instead a "execute the task and terminate"-style behaviour. So, Tasks were the way to go:
    def push_hash(bsp_key, urls) do
      DynamicSupervisor.start_child(
        __MODULE__,
        {Task,
         fn ->
           Rudder.Pipeline.process_specimen(bsp_key, urls)
         end}
      )
    end
  end
With the above change, rudder went from being slowly memory-hogging, to having stable memory requirements.
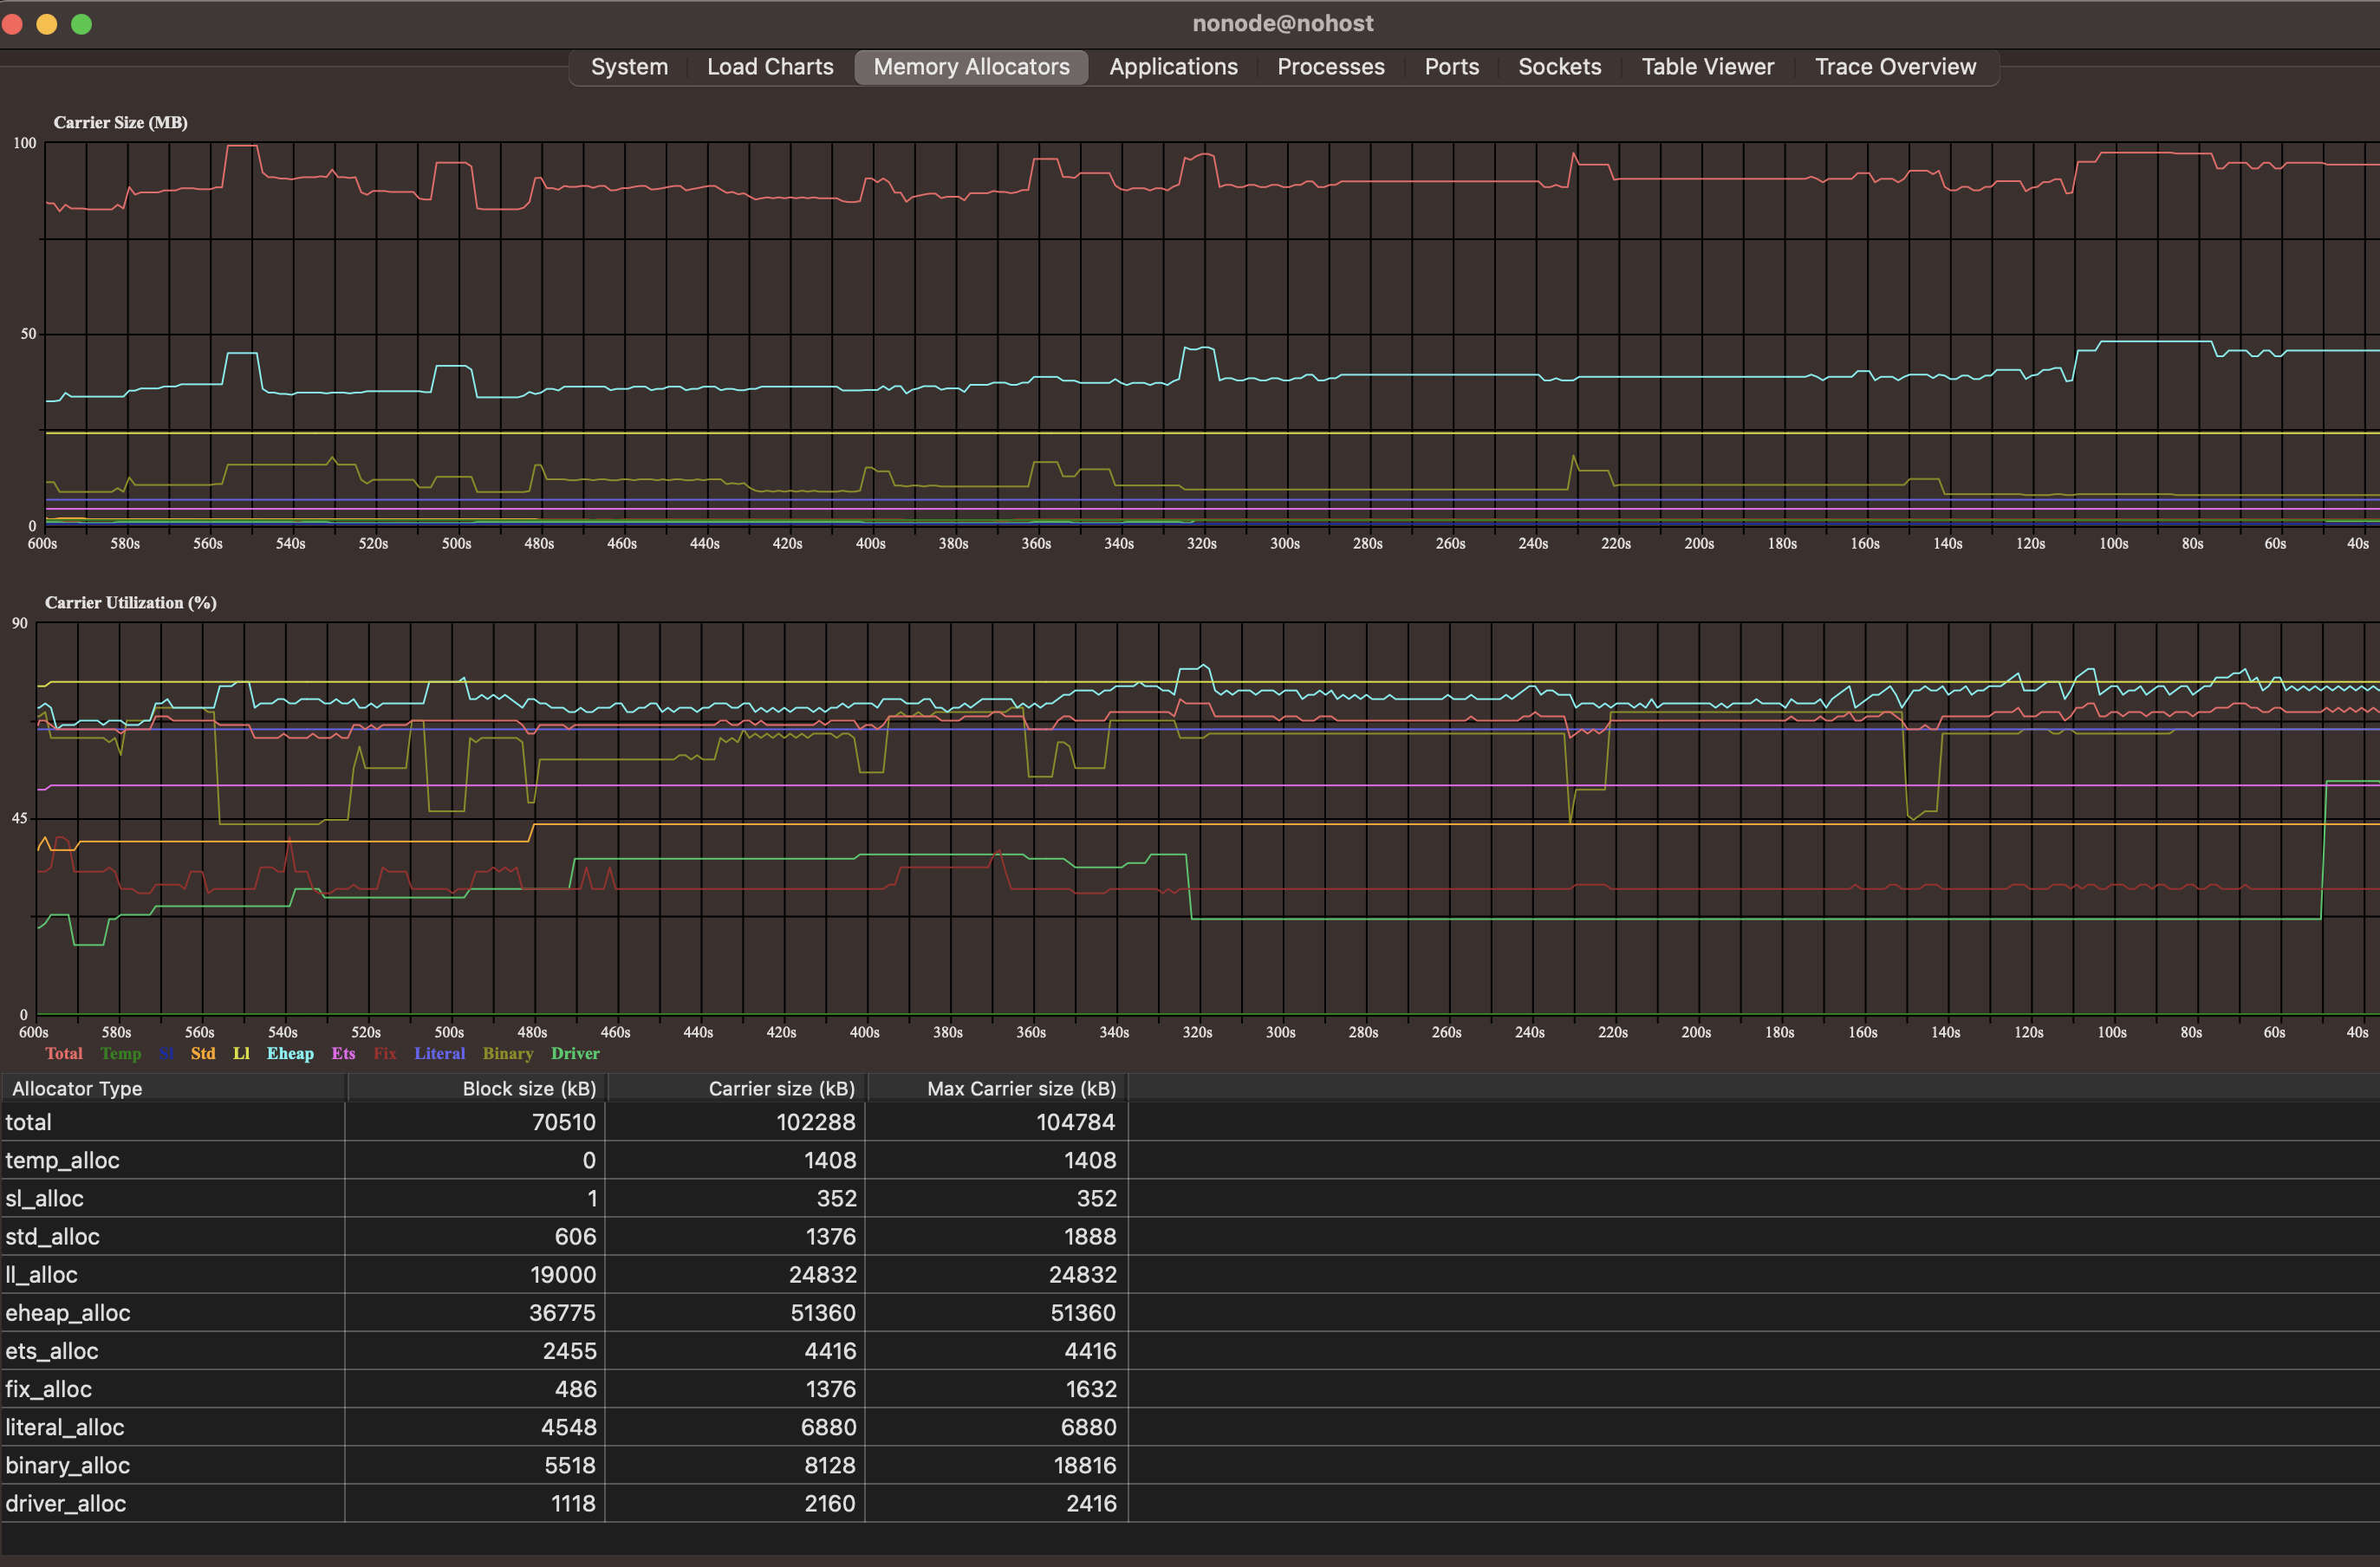
Stable memory usage